


#20 Power BI UPDATE - march 2026 - What’s New
BLOGUPDATE OVERVIEWPOWER BIFABRICAI
Sebastian Jagniątkowski
5/21/2026
April’s update from Microsoft falls into the “evolutionary” category. After a series of major announcements, we’ve been given a month to cool things down. There are no big fireworks this time—rather, a collection of smaller improvements aimed at enhancing day-to-day work in Power BI. Three themes stand out most: continued improvements in report layout control, a stronger Copilot presence in mobile apps, and several meaningful enhancements in modeling.
Below are the selected topics covered in this summary:
Plus many smaller updates and changes such as:
Cleaner naming for formatting settings
“Fixed size” option for more visuals
Better labeling of preview visuals
Improved Azure Maps style synchronization
Smart Narrative powered by Copilot
Retirement of the old file picker UI in Power BI
Deprecation of the “Netezza ODBC” driver
Enjoy the read! 🧐
🎨 Continuation of report style improvements
There is a lot happening on the reporting side. Microsoft continues to introduce small but essential changes to ensure that Power BI reports look fresh and lightweight out of the box, without heavy customization. A new toggle has been added to theme settings, allowing users to switch between default styles.

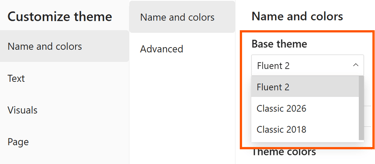
Not long ago, Microsoft introduced the Fluent 2 theme as the default, bringing a more modern look to report canvases. In practice, however, custom themes (widely used across organizations) could conflict with Fluent 2 settings. In response, Microsoft added a toggle to revert to earlier default styles and support smoother transition.
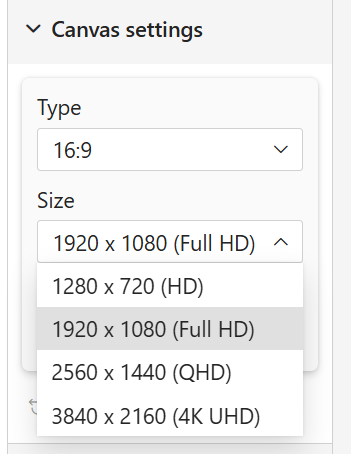

We also finally received expanded canvas settings. A small but very practical improvement: instead of manually setting page size in pixels, you can now use predefined presets, making it easier to match report layouts to common screen sizes. This is especially useful for reports displayed on TVs - no need to remember exact 4K dimensions. A “Custom” option is still available when needed.
Additionally, there are small fixes for tables and matrices. Banded rows and +/- hierarchy buttons are now enabled by default, and axis colors correctly respect theme settings, which was previously inconsistent.
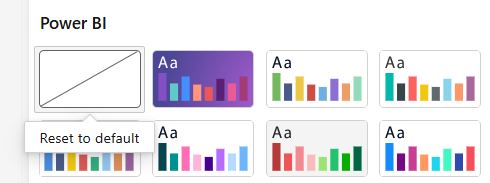
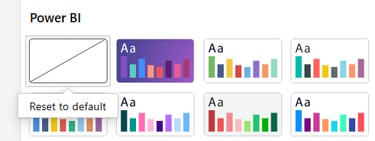
It’s also worth mentioning that the default theme icon has been updated, so it’s now easier to distinguish from the other presets. Just remember that switching between themes only affects formatting elements that you haven’t manually customized.
So for example, if you changed the title color in a pie chart, that action overrides the default styling. Because of that, changing the style later on won’t revert those changes automatically. To bring it back, you need to use the “Reset to default” option in the formatting pane for that specific visual. This only applies to that one object though. Any new pie chart you create will already follow the default settings coming from the style you selected.
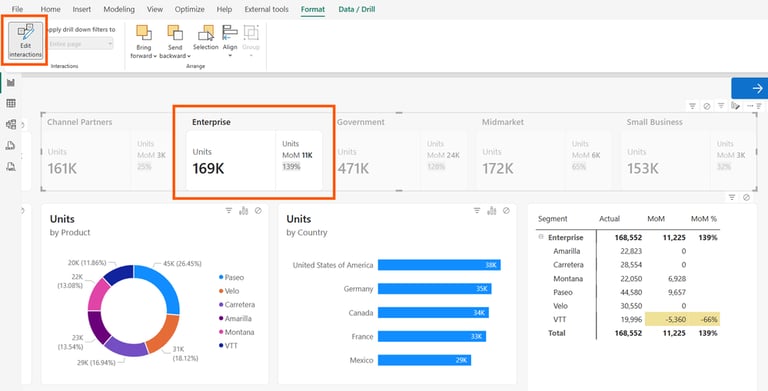
🔢 Card visual that finally behaves properly
The Card Visual is definitely evolving from a simple KPI tile into a much more fully featured reporting element. With almost every update, it keeps gaining more customization options while behaving less like a static card and more like an interactive part of the report itself. In this release, Microsoft focused mainly on improving Card Visual interactions. Now, when you click a category header, the selected card gets highlighted while the remaining ones subtly fade into the background. On top of that, interaction control between the Card Visual and other report elements has been improved, giving developers more flexibility in how visuals respond to user actions.
Microsoft also expanded the capabilities of the headers displayed inside the Card Visual itself. When you place multiple columns into the category field, their names can now be combined into a single, cleaner header, which improves overall readability.
Additionally, support for Base64-encoded images has been improved, removing the need for some of the workarounds developers previously used when setting custom card tile backgrounds.
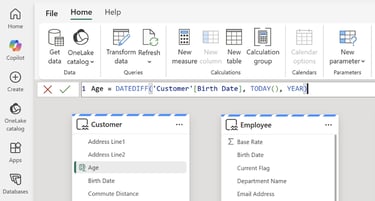
🌊 Modeling flexibility in Direct Lake
With the April Power BI update, Microsoft introduced a more flexible framework for working with Direct Lake models. Fewer hard limitations, more room for context-driven scenarios, including the ability to create calculated tables and calculated columns directly in Direct Lake. This feature is currently in Preview, so it should still be approached carefully, but it’s definitely worth keeping on the radar because it could soon influence entirely new modeling patterns in projects built on top of Direct Lake.

Microsoft also pointed out one of the potential use cases for this functionality. It’s especially useful in situations where making changes directly at the source level isn’t possible, for example due to limited access or governance restrictions around those resources. The rules for creating calculated tables and columns in Direct Lake are essentially the same as in standard modeling scenarios, such as Import mode.
🌍 Columns that know who is looking
If you build reports that serve multiple regions at once, this feature is definitely something worth paying attention to. User context aware calculated columns (Preview). Calculated columns can now be defined with a programmable evaluation context. What does that mean in practice? The column name a user sees in a report can depend on a dynamic result returned by functions such as:
UserCulture()
UserPrincipalName()
CustomData()
As highlighted in the feature notes, this opens the door to entirely new possibilities, especially around translations. It also enables more creative ways of shaping the user experience, for example by presenting slightly different naming conventions to end users (Viewers) and more advanced users who extend solutions on top of the model.
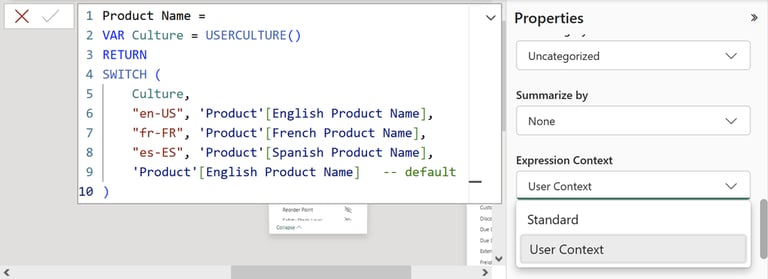

This capability works for calculated columns in Direct Lake, Import, and DirectQuery models, and is controlled via the Expression Context property. That’s an important detail, because this is not a source-specific feature but rather a modeling approach that can span across different storage modes. The real value here isn’t just “dynamic DAX”. It’s the shift toward models that behave more like user-adaptive layers, where not only the results are personalized, but also the structure and metadata of the model itself can adjust to the consumer.
🧠 NAMEOF becomes more precise
As part of DAX user-defined functions (Preview), the NAMEOF function has received new optional parameters that allow you to control which part of an object’s name is returned and how it is formatted for display. The new syntax looks like this:
NAMEOF ( <object> [, <component> [, <escaped>]] )
Instead of returning the full object reference, you can now explicitly specify whether you want the table, column, measure, or even a calendar name. This opens up several practical scenarios, especially for building dynamic descriptions, labels, helper text, or any other UI elements that rely on model metadata to generate readable names.
Microsoft also emphasizes that the extended behavior of NAMEOF() does not break existing models, thanks to the optional nature of the new parameters in the syntax.
🤖 Copilot AI with improved mobile access
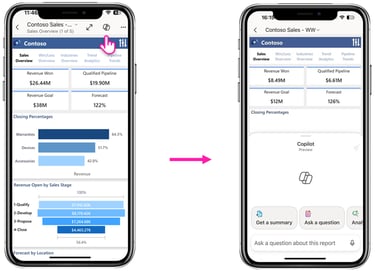
Microsoft has just delivered another set of improvements to Copilot in the Power BI mobile experience. Instead of generic summaries and pre-defined prompt suggestions, the mobile app now supports a fully open conversational experience with the AI chat, similar to what is already available in the Power BI Service.
Copilot in the mobile app can handle open-ended questions and follow-up prompts within the context of a report, with responses grounded in specific visuals. This makes it easier to trace where the AI is getting its conclusions from and validate its output directly against the report. It’s also worth noting that the prompt limit is set to 10,000 characters. Among the key updates in this area is voice dictation support for iOS users, which can be especially useful when speaking a question is simply faster and more natural than typing it out.

At this point, Copilot in Power BI mobile is moving beyond being a nice add-on and is becoming a fully-fledged assistant for analyzing reports on the go. It also raises a practical question: do you actually know how many of your users consume reports on phones or tablets? You can check that in activity logs. It might be a good moment to rethink whether your reports are properly optimized for mobile view.
🆕 A few things off the main stage worth noting
Cleaning up formatting settings naming
Microsoft has decided that “Fit to space” is a clearer and more intuitive naming than the previously introduced “Autogrid”, so the newer name is being reverted. This change also applies to the List Slicer, where the option previously called “Fixed number of buttons” is now also renamed to “Fit to space” for consistency. To clarify the behavior: when enabled, elements grow or shrink to fill the available area. When disabled, the visual reserves space for a fixed number of elements, even if fewer are currently present.
“Fixed size” option for additional visuals
A new “Fixed size” option is now available in the Layout section for three visual types: card visual, button slicer, and list slicer. This is a welcome change for anyone who prefers full control over layout behavior. With this setting enabled, elements no longer rescale dynamically when the container size changes, but instead keep their defined dimensions. This is especially useful in hierarchical scenarios, where expanding or collapsing levels can change the number of visible items. A fixed size ensures layout stability. It also helps in multi-device scenarios, where screen sizes vary. If there is not enough space to display everything at the intended size, Power BI will simply introduce a scroll bar instead of distorting the layout.
Clearer labeling of preview visuals
Visuals that are not yet GA (generally available) will now include a “(Preview)” suffix in their name, for example “List Slicer (Preview)”. This comes in addition to the lightning icon indicator. The change addresses feedback from users and administrators, since many organizations restrict preview features and need clearer visibility of what is still experimental.
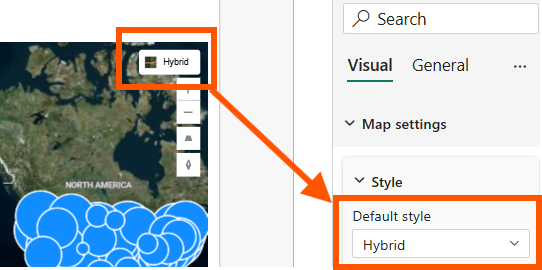
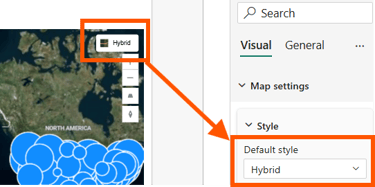
Better synchronization in Azure Maps
Changes made to map styles directly on the visual now sync properly with the formatting pane. This removes the previous situation where two separate sources of truth could exist for the same setting.


Copilot-powered Narrative visual
The Smart Narrative visual is getting an upgrade with Copilot integration (license required). Report authors can now choose between the traditional manual approach, which offers full control, or letting AI generate the narrative dynamically.
Deprecation of the old file picker experience in Power BI
As previously announced, the legacy file picker UI has been retired and replaced with a refreshed default experience.
Removal of the Netezza ODBC driver
The older built-in version of the Netezza ODBC driver has been deprecated in favor of a newer release. If you’re still using IBM Netezza connections, this is a good moment to verify compatibility. Existing connections should continue to work, but it’s worth confirming everything behaves as expected.
✅ Wrapping up
April 2026 isn’t a release driven by headline-grabbing changes. The announced updates are more about refining the foundations of the ecosystem, with the biggest benefits going to people building reports from a visual layer perspective, fine-tuning layouts, and looking for more modeling flexibility without relying on workarounds. It’s the kind of release that improves day-to-day workflows rather than saving hundreds of hours on projects.
⭐ TOP 3 things worth paying attention to right away:
Calculated columns with user-aware context (Preview)
A feature that may look niche at first glance, but it has strong potential to quickly become part of serious production scenarios. It opens the door to translation layers, personalization, and truly user-adaptive models.
Calculated objects in Direct Lake (Preview)
A meaningful step toward more flexible modeling. If Direct Lake is expected to grow in adoption, features like this help reduce the pressure to fall back to Import mode just to perform basic transformations inside the model.
Stronger Copilot in Power BI Mobile
Mobile users are now getting full conversational interaction with Copilot inside Power BI Mobile, instead of limited summaries. The idea of analyzing report data with an AI assistant from anywhere is no longer theoretical, but practical.
You can also check out the other posts on the blog. You’ll find earlier update summaries and additional insights explained in a simple, practical way, without unnecessary complexity and with the goal of saving you from going through long documentation.
Feel free to check out my Instagram (PL) and LinkedIn (ENG) profiles for more content. 😊
And be sure to browse my other blog posts: [LINK]